This dashboard is part of a reporting portal I built to support faster, clearer decision-making across sales, traffic, and customer behavior. I developed the entire system from scratch using raw SQL and Django, making sure every part reflects how teams actually use data in real business settings. The focus was on creating something that is both reliable and fast, especially during busy reporting cycles when accuracy and speed matter most.
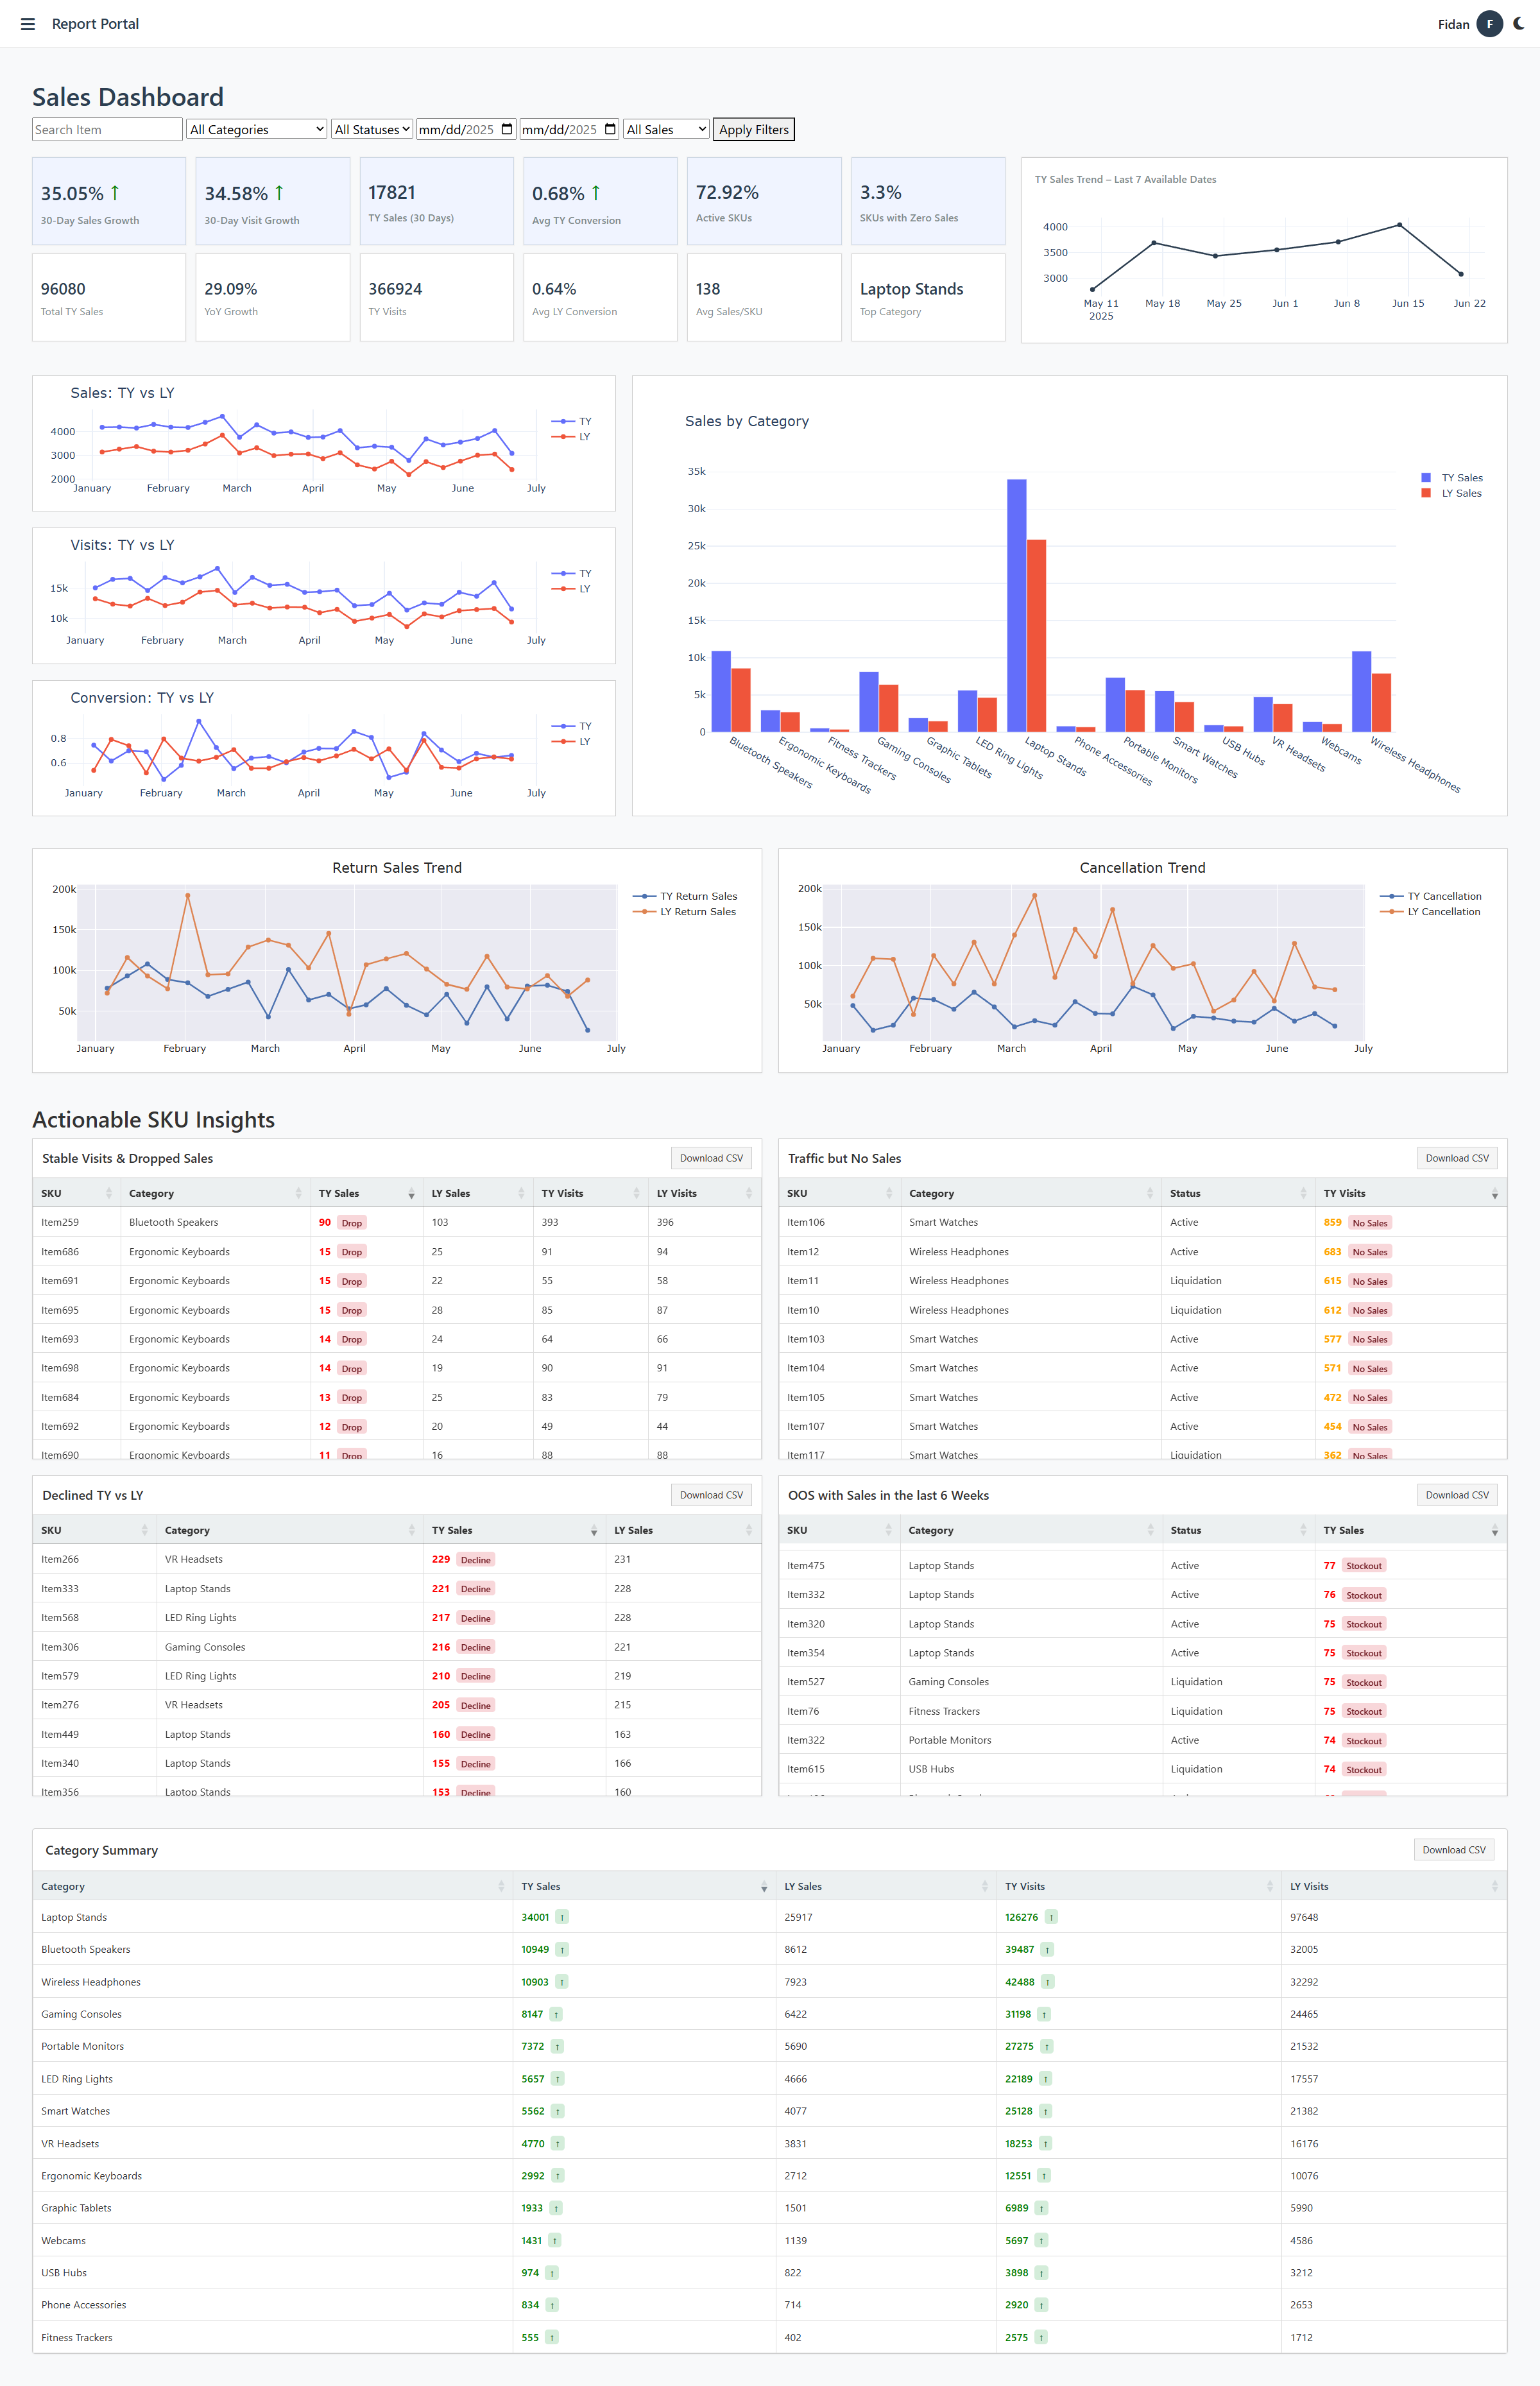
This section focuses on sales performance. It gives a live, interactive view of how products are performing across categories, channels, and time periods. Filters at the top allow users to adjust by product type, stock status, date range, and sales type. As selections are made, all charts and metrics respond instantly.
Rather than just displaying numbers, the dashboard helps highlight real issues and trends. It brings attention to areas like products with stable traffic but no sales, drops in conversion, or high-performing categories that are driving results.
To protect sensitive business information, the data shown here is entirely modified. Product names, categories, and values have been replaced with sample inputs while keeping the full structure and logic of the original system.
Dashboard Features
Real-Time Filters
Flexible filtering by category, stock status, sales type, and date to adjust the full dashboard view.
TY and LY Comparison
Clear trendlines showing this year's performance against last year's, matched by date for reliable insights.
Conversion and Traffic Tracking
Tracks how traffic and conversion rates shift over time, with clean visit logic to reduce noise.
Out-of-Stock Opportunity
Surfaces SKUs that are currently out of stock but had sales in the last six weeks, helping teams catch items that may need urgent restocking.
Downloadable Tables
All tables can be exported as CSV, including raw data, summaries, and insights.
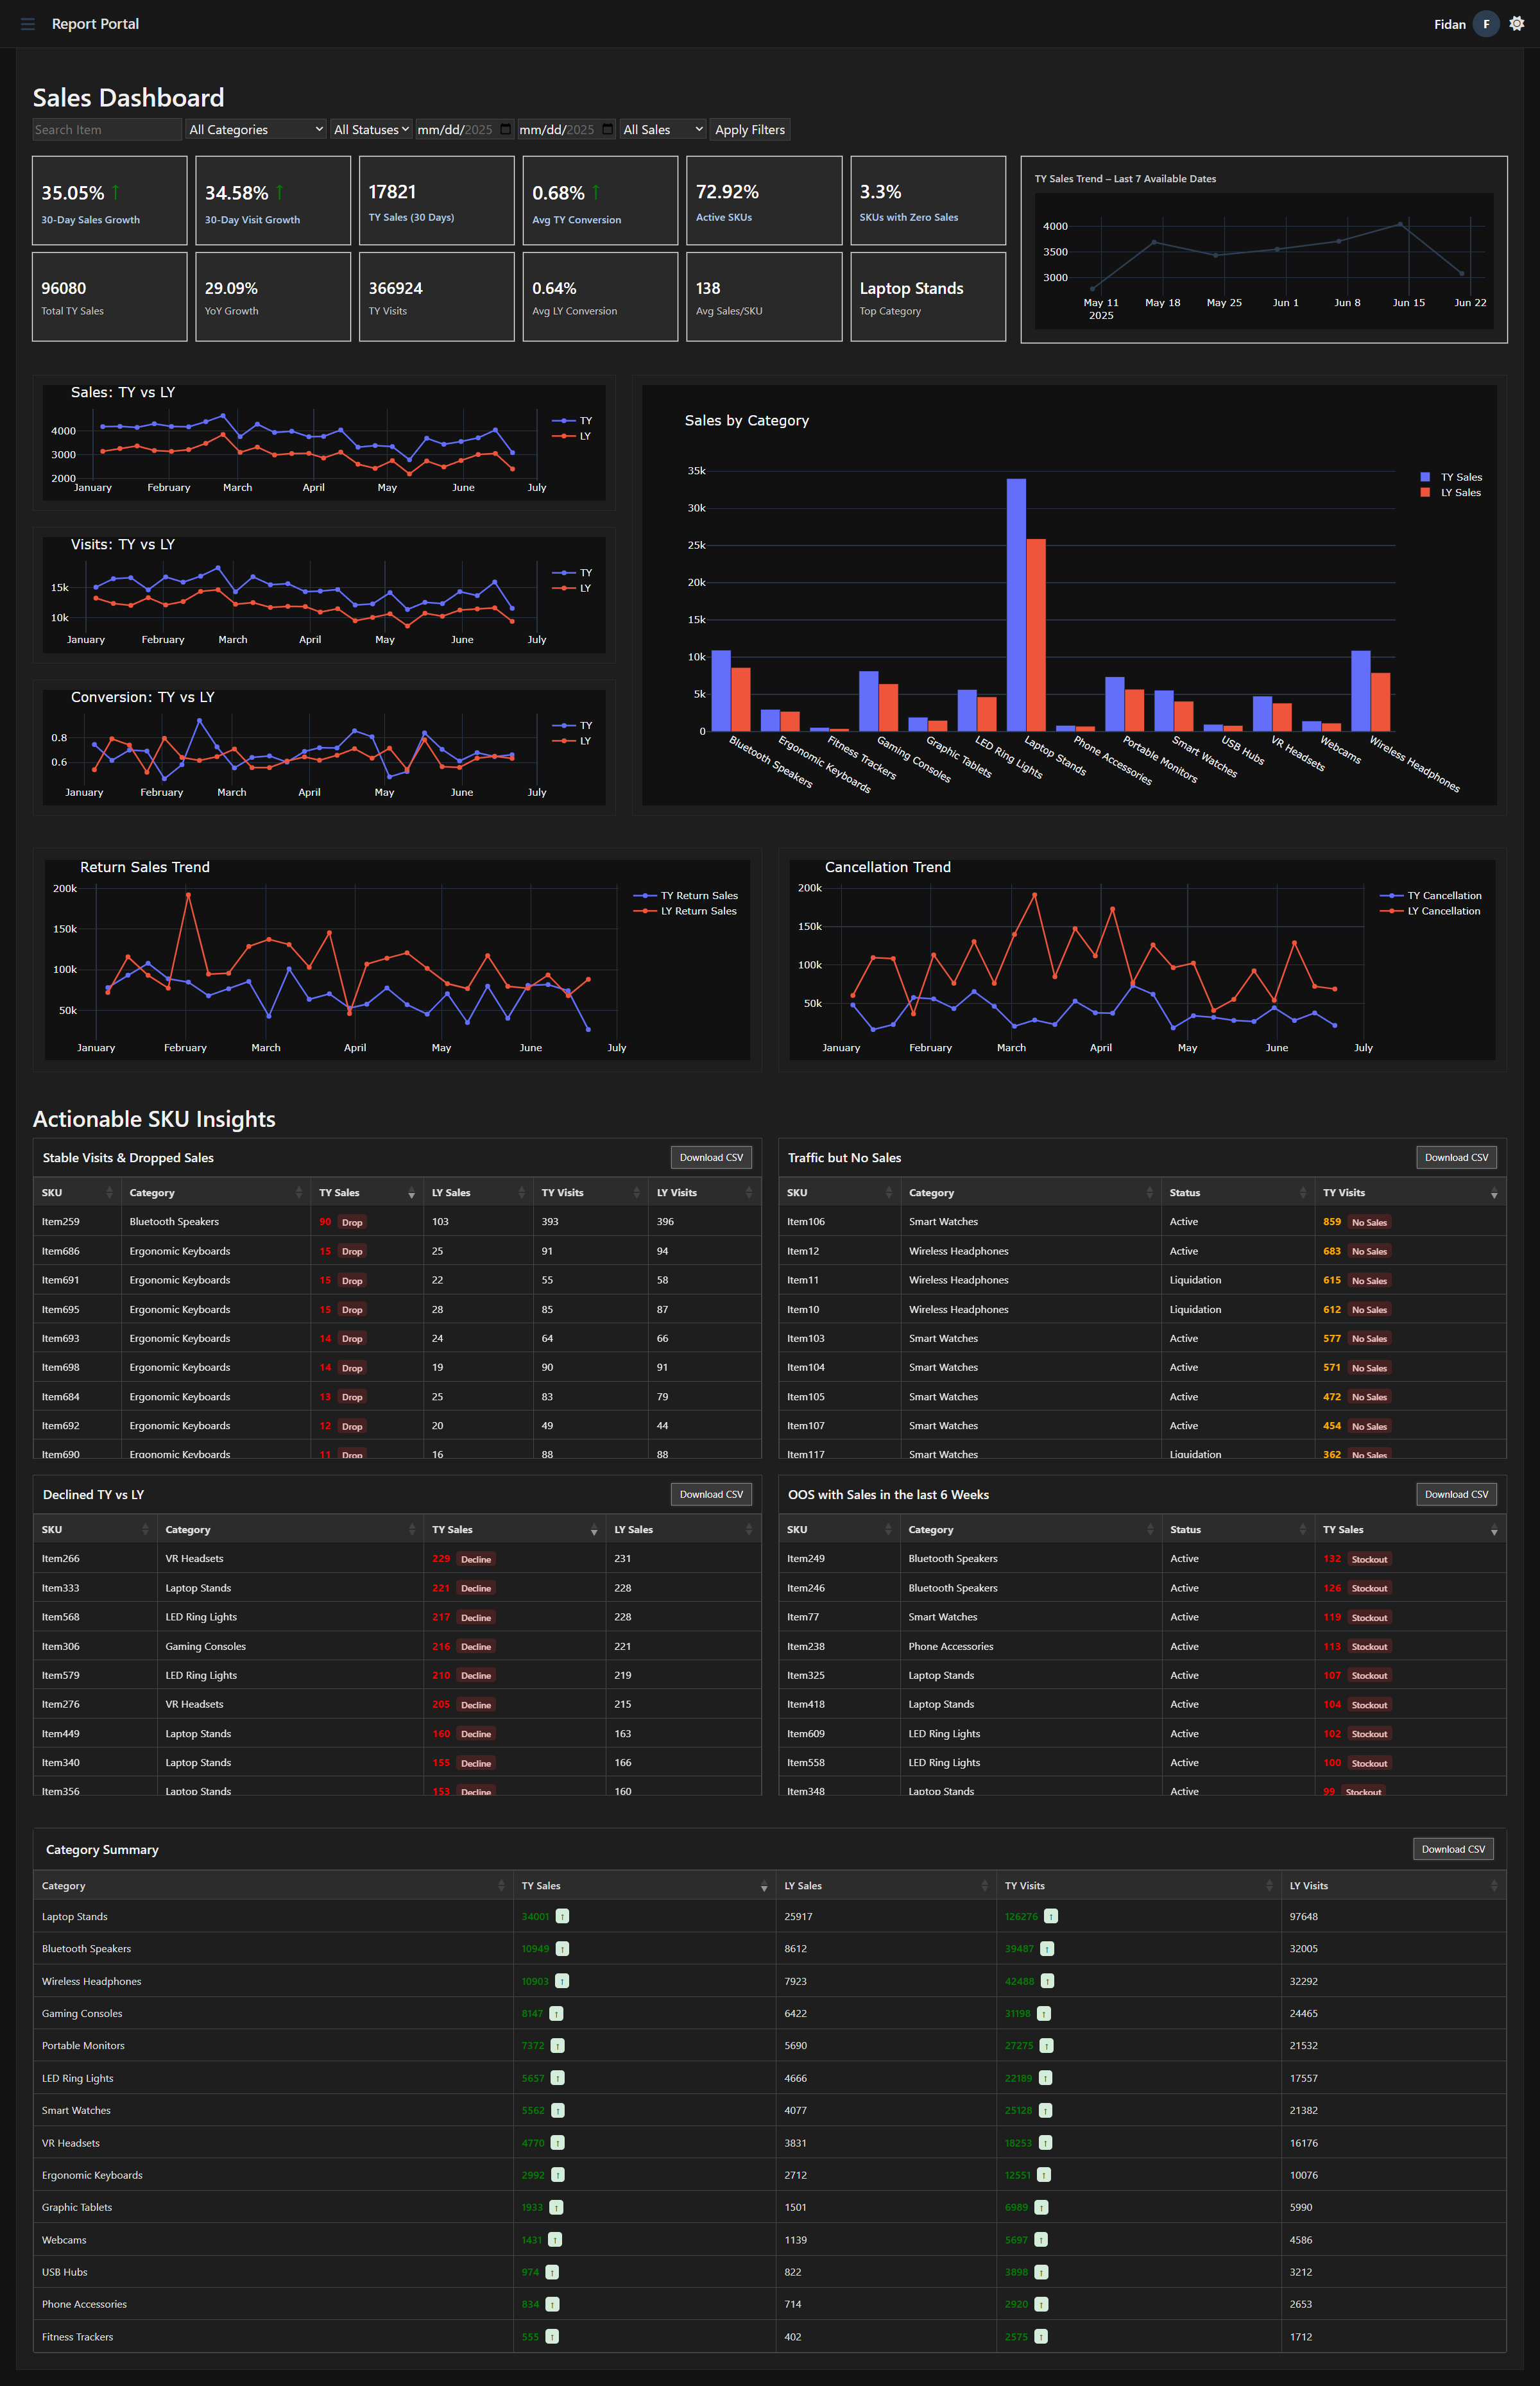
Dark Mode Ready
Fully styled for both light and dark themes, with consistent look across charts, KPIs, and tables.
SKU-Level Insights
Highlights issues like traffic without sales, stable visits with sales drop, and performance decline.
Live KPI Tiles
KPIs update based on selected filters, reflecting only what is shown in the current view.
Sales Knowledge Behind the Logic
- When sales drop but traffic stays steady, it often points to hidden issues like pricing, listing errors, or poor visibility. This dashboard helps catch those moments early.
- Products that go out of stock and still generate recent sales are flagged for restocking, preventing lost revenue and missed opportunities.
- Conversion rates are calculated using a stable visit baseline to avoid misleading trends caused by traffic spikes or seasonal noise.
- Performance is tracked both at the SKU level and across categories, making it easier to catch declines that might otherwise go unnoticed in high-level summaries.
- Each insight is built to reflect real sales behavior, using patterns that align with how operations and e-commerce teams think on a daily basis.
- The logic was shaped by hands-on experience with online retail data, not guesswork, making it immediately usable by sales, merchandising, or analytics teams.
- Problem areas like conversion drops, traffic with no sales, or declining SKUs are automatically surfaced without needing to dig through raw reports.
- Every part of the dashboard is designed to answer the kind of questions teams actually ask, helping people focus faster and act with confidence.